

- Notcoin’s creators used Telegram to build a community for the token.
- Key indicators suggest that the potential of a price rise is diminished despite Notcoin’s burning 233 millions tokens.
Notcoin [NOT] In the past 30 days the price of the token had fallen 31%, showing signs that the market was exhausted. On-chain and technical metrics suggest a slowing down of the momentum.
Weakening price strength
TradingView’s 4-hour NOT/USD chart shows the Relative Strength Index has trended downwards ever since the peak near the overbought area on September 9.
The downward-trending 4-hr RSI shows that the price has fallen due to selling pressure.
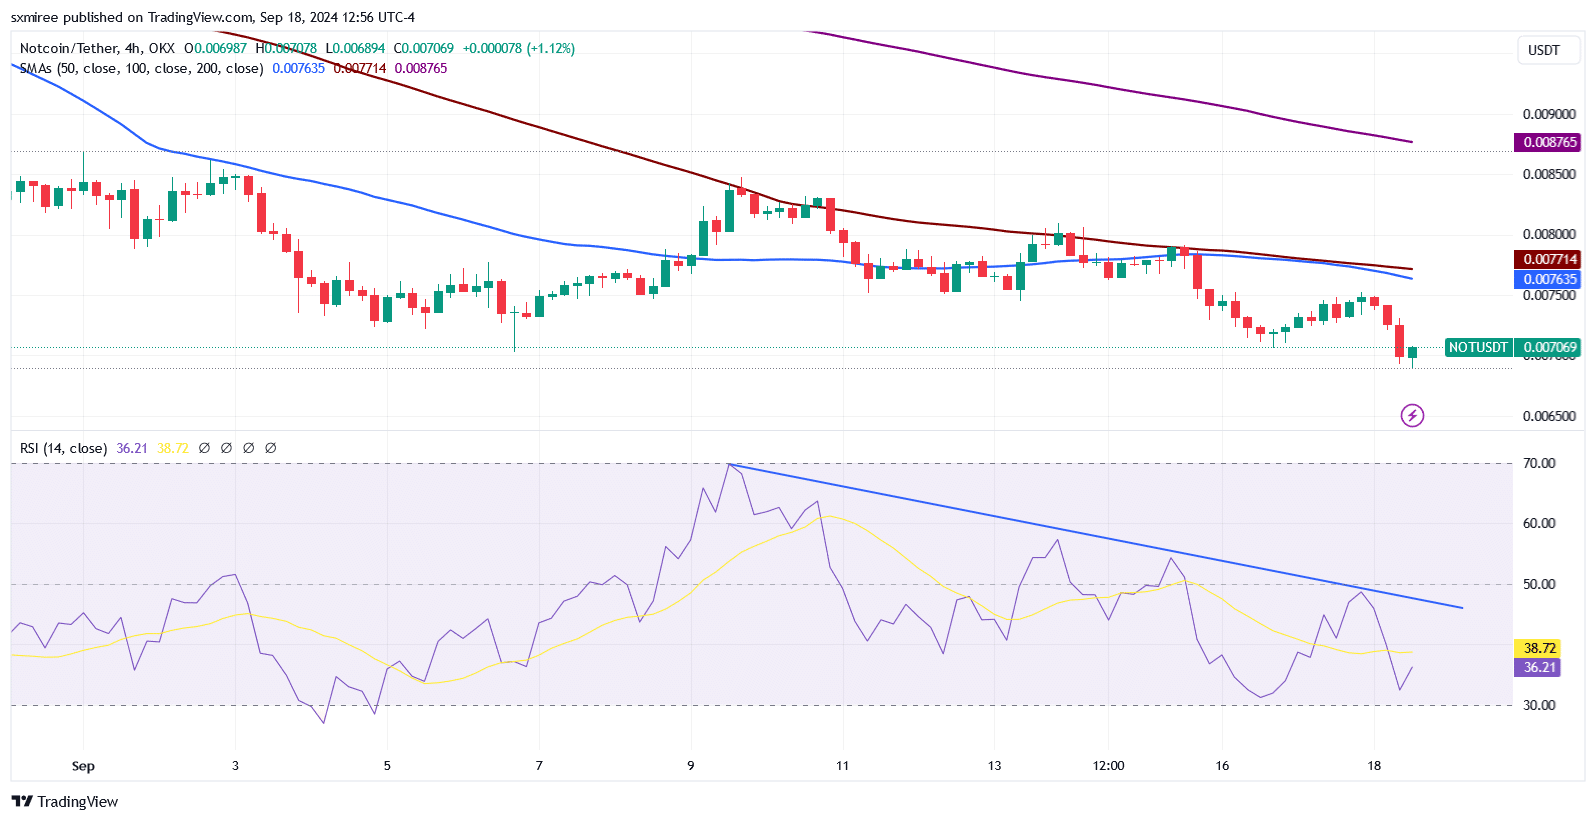
TradingView
IntoTheBlock data shows that only 23% Notcoin addresses at the current price are profitable, while a shocking 65.50% of them are losing money.
At $0.0083, 171,780 accounts holding 3,59 billion tokens in total are below the water line.
Network activity declines
The on-chain metrics show a decline of Notcoin’s activity in the network, proving that there is less excitement about the game.
The number of addresses added to the network has fallen by 41.9% over the last seven days. Meanwhile, the number active addresses dropped by 49.2%.

Source: IntoTheBlock
In line with this trend the ratio of active addresses (expressed in percentages) decreased throughout September. This indicates a dwindling engagement by users.
Notcoin recorded a low ratio of active addresses of 1.13% for the 30 days ending September 17. This is down from its 30-day peak of 3.76% reached on September 5.

Source: IntoTheBlock
The number of transactions on the network has been similarly affected. Since September 13, the number of transactions has been consistently below 50,000. On September 17, it reached its lowest level in 7 days, 41.23K.
In this month’s data, the daily number of large transactions also decreased. The lowest was 3 transactions in a single day on 16 September. It is clear that whale activity has decreased and even those with deep pockets are pulling back.
Not/USDT Outlook
The NOT traded slightly above $0.0070 as of the time this article was written. next cushion around $0.0044. Since June, the 1-D chart of NOT/USDT shows that both pairs have been in a pattern called a “falling wedge” and are constantly testing lower resistances.
A slip below the support level currently in place could result in extended losses due to the low buying interest on the market.

TradingView
The 4-hour chart shows that the price of NOT/USDT is consolidating in the range $0.007-$0.0084. This has been the case since September began.
The pair rose up to $0.0076 in September before it was rejected. This was followed by a reverse of course, following its current price movement under the descending resistance.
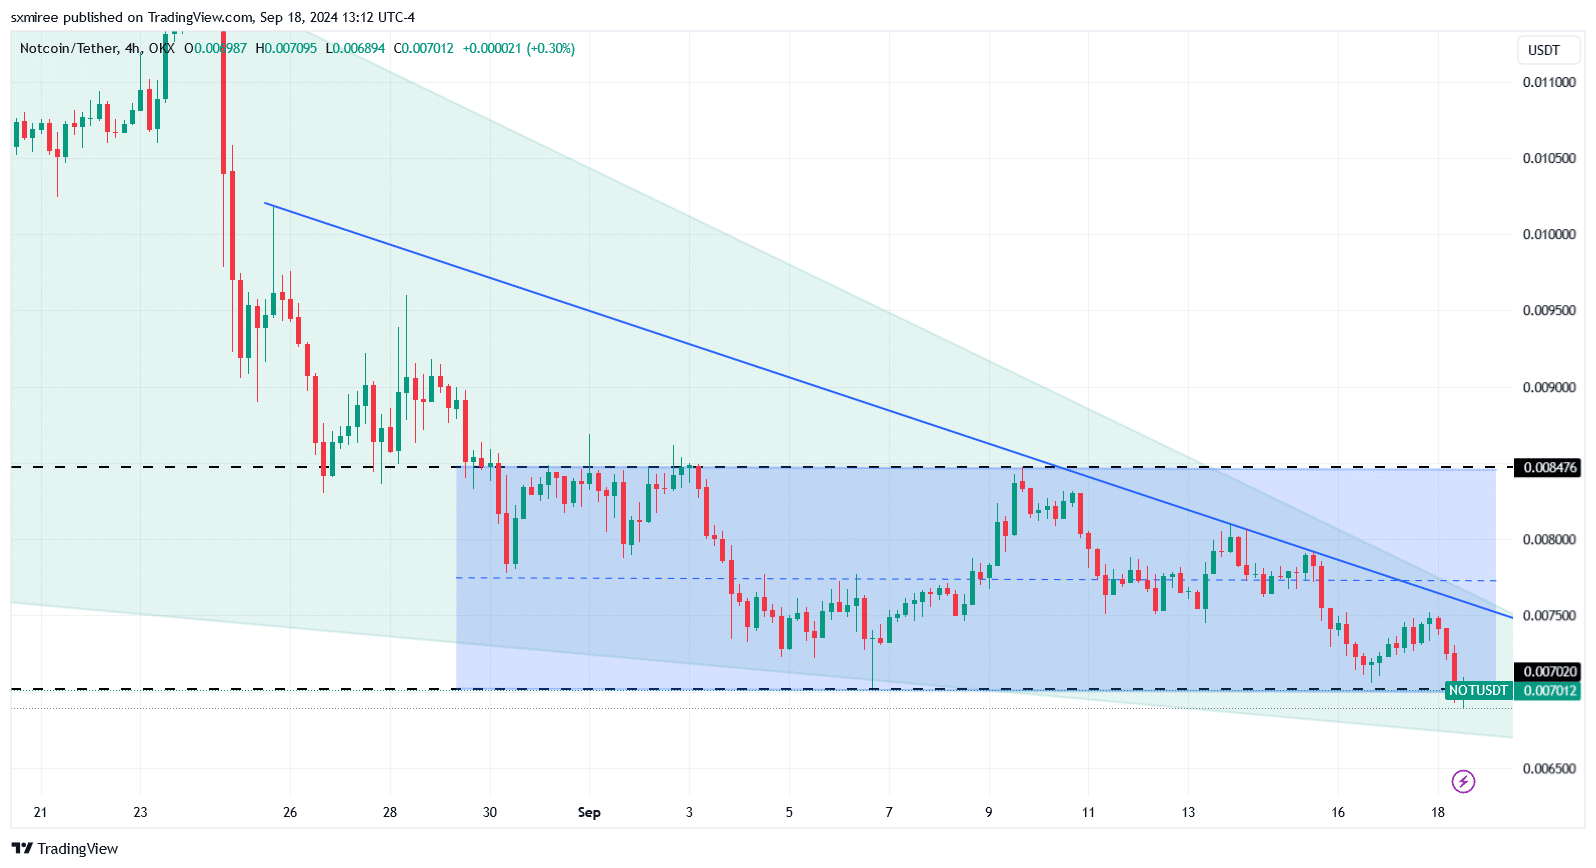
TradingView
It is worth noting that the correlation between Notcoin and Bitcoin (BTC), as well as Ethereum (ETH), has grown throughout the month.
You can read more about it here Notcoin’s [NOT] Price Prediction 2024–2025
IntoTheBlock’s data indicates that, as of August 20, the 30-day correlation value between NOT and ETH is 0.81. This is close to its previous high point of 0.85.
This growing correlation shows that the NOT price is closely linked to the altcoin’s flagship.
“This article is not financial advice.”
“Always do your own research before making any type of investment.”
“ItsDailyCrypto is not responsible for any activities you perform outside ItsDailyCrypto.”
Source: ambcrypto.com