, dogwifhat(WIF), Solana(SOL), AEVO (BONK),")

Bitcoin reached its new historic high on March 14 at $73,809. The demand for Bitcoin Exchange-Traded Funds (ETFs) has driven this upward trend, with an inflow of $1 billion or more into Bitcoin ETFs on March 12, a new record.
Over 330,000 Bitcoin were purchased by two of the largest Bitcoin ETFs in comparison to the 65,500 Bitcoin that was mined for the year. In the short-term, this strong demand will likely provide Bitcoin with a price floor.
Bernstein’s analysts predict that Bitcoin will reach $150,000 around mid-2025. They caution, however, that there may be some bumps along the way, which is common in bull markets. The rapid changes in mood can cause corrections. For example, when the data of IntoTheBlock shows that Bitcoin is currently profitable for all investors, this could spark a selling off if Bitcoins’ price falls below critical support levels.
Is Bitcoin due for a correction, which could lead to an overall decline in altcoins given the current trends? We’ll look at the charts for the 5 most popular cryptocurrencies to determine this.
Bitcoin Price Analysis
The long tail of the candlestick showed that strong buyers were able to counteract the attempts by bears at initiating a pullback.
, signaling robust purchases during intraday lows. Sellers continue to defend an increase above $74K. At the time of this writing BTC price Trades at $72,850. Down over 0.3% on yesterday’s price.
Since several days the BTC/USDT pairs has climbed within the upper area of a ascending channel pattern. Yet resistance has continually capped gains. The bulls could still increase the momentum if they manage to take the price above the boundaries of the channel. This would potentially push the pair past $80,000.
If the price falls below $70,000, the pair could retreat back to the boundary of support. The bears could push the price even lower, pushing the pair all the way down to $63,000.
Prices of dogwifhats (WIFs)
WIF’s price was pushed to $3 by bearish traders. The lower shadow of the day’s candlestick indicates traders take every drop in price as a buying opportunity. WIF’s current price is $3.3, a 25 percent increase from yesterday.
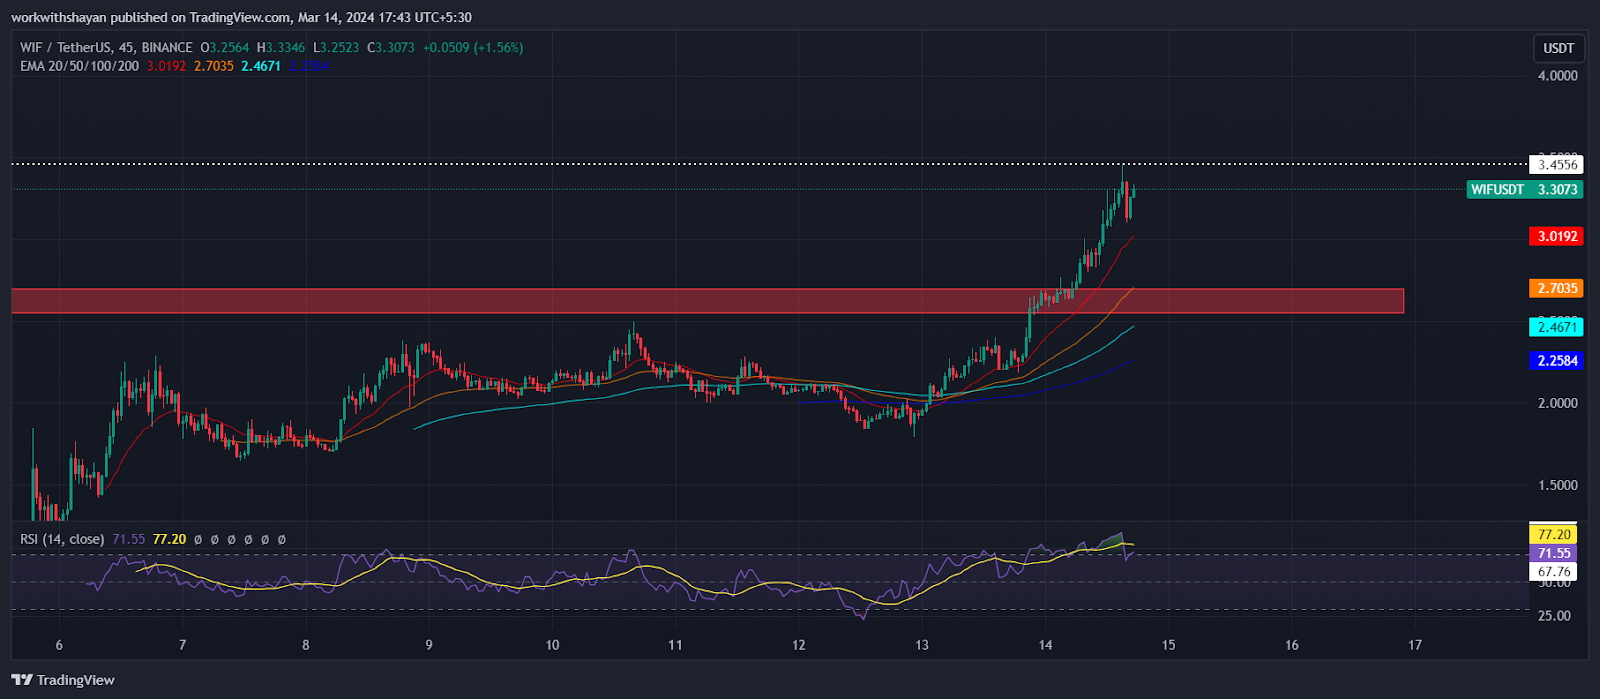
Buyers are currently trying to move the price past the $3.5 barrier. If this is achieved, it could be the beginning of a fresh upward trend in the WIF/USDT currency pair. It may even reach a brand new ATH.
The rally may be disrupted, but there is some concern. Relative Strength Index has been overbought for a couple of days. This could indicate that the market is too hot, and may correct or stabilise. Keep an eye out for $2.6 as the critical support level if a downward trend occurs.
Solana (SOL) Price Analysis
Recently,
The trend is upward. The burning wicks at the 13th and 14th of March candlesticks show strong interest in buying during intraday price declines. From $150, the price is now heading for $200. SOL currently trades for $172. That’s a rise of over 12.5% compared to yesterday.

The SOL/USDT combination is set to advance towards $184 if the price remains above $155. With the 20 day EMA sitting at $157 as well as the RSI indicating an overbought state, the current market is heavily skewed to the bulls. But a short-term surge towards $200 can be expected.
On the downside, the key levels are the $149 breakout level and the SMA 50 days at $123. The bears would be in full control if the market fell below this support level.
AEVO Price Analysis
AEVO’s price dropped significantly, reaching $2.9 as a key level for support, but failing to breach it. The price was successfully held at $2.9 despite attempts from sellers to lower it. This suggests that buyers are trying to make $2.9 a solid support level. AEVO’s price is currently trading at $2.9, down over 10% from yesterday.
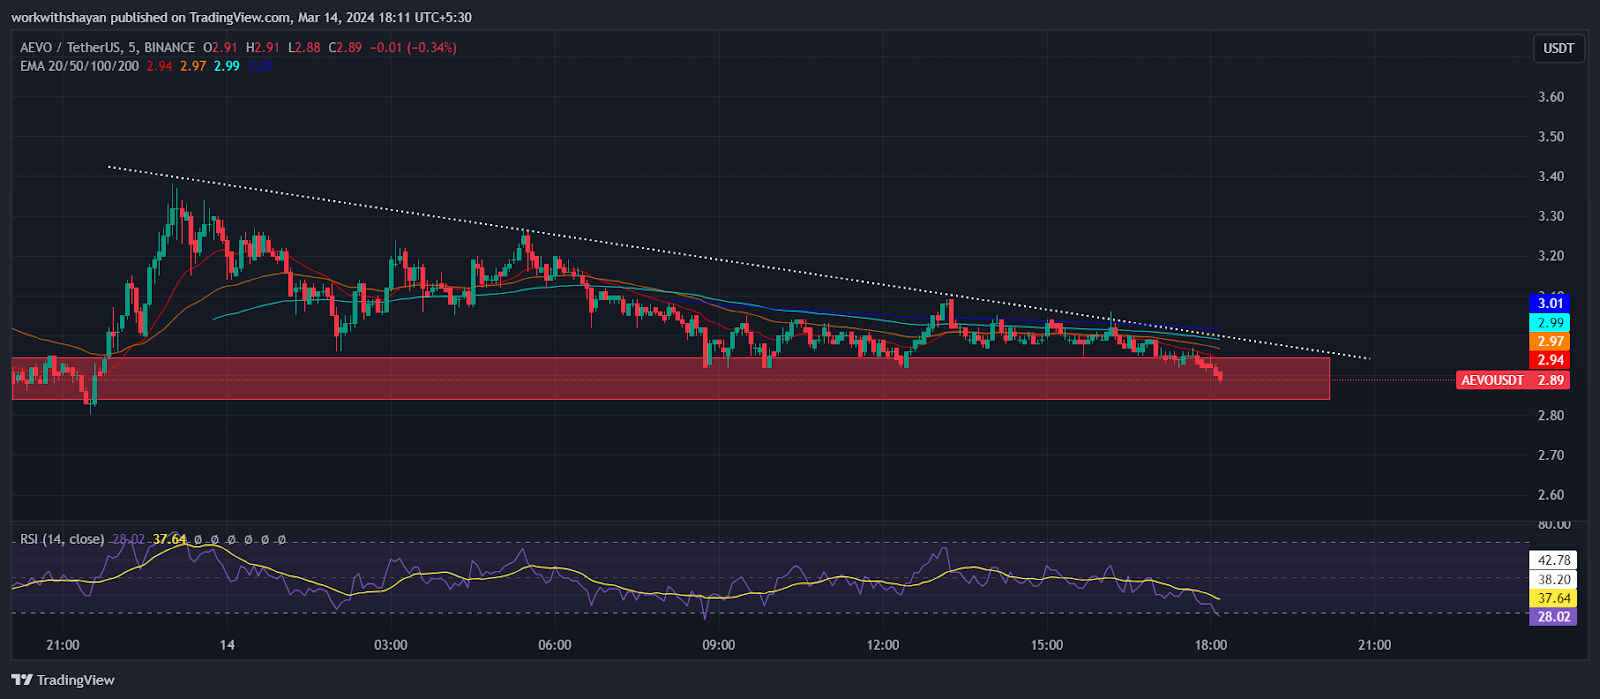
We might experience a spike in purchasing pressure if AEVO prices hold above their current range, and move towards the upward trend line. Achieving it could propel the AEVO/USDT trade pair beyond the $3.1 threshold, potentially launching a rally to $3.3 or even $3.8.
A downward move that breaks the $2.9 level could indicate a lack of buyers’ momentum, leading to an eventual fall toward $2.6.
BONK Price Comparison
Recent pressure from bulls has not been enough to lift BONK over the $0.00007 barrier, but they have continued to apply it. The bears are aiming for a rapid decline under the Fib channel. Bonk is currently trading at $0.000035. This represents a 19% increase from the rate of yesterday.

An ascending 20-day EMA, at $0.000032, and a positive RSI suggest a more likely upward trajectory. The BONK/USDT pairing could be propelled to $0.000041 if the price of BONK remains above $0.00003. Passing through this threshold could lead to $0.000045, and then $0.00005.
If bears manage to pull down the price of the pair below $0.00003 then they gain control. They could potentially drive it as low at $0.000025, and even reach the 50 day SMA, which is $0.000014.
“This article is not financial advice.”
“Always do your own research before making any type of investment.”
Source: blockchainreporter.net